
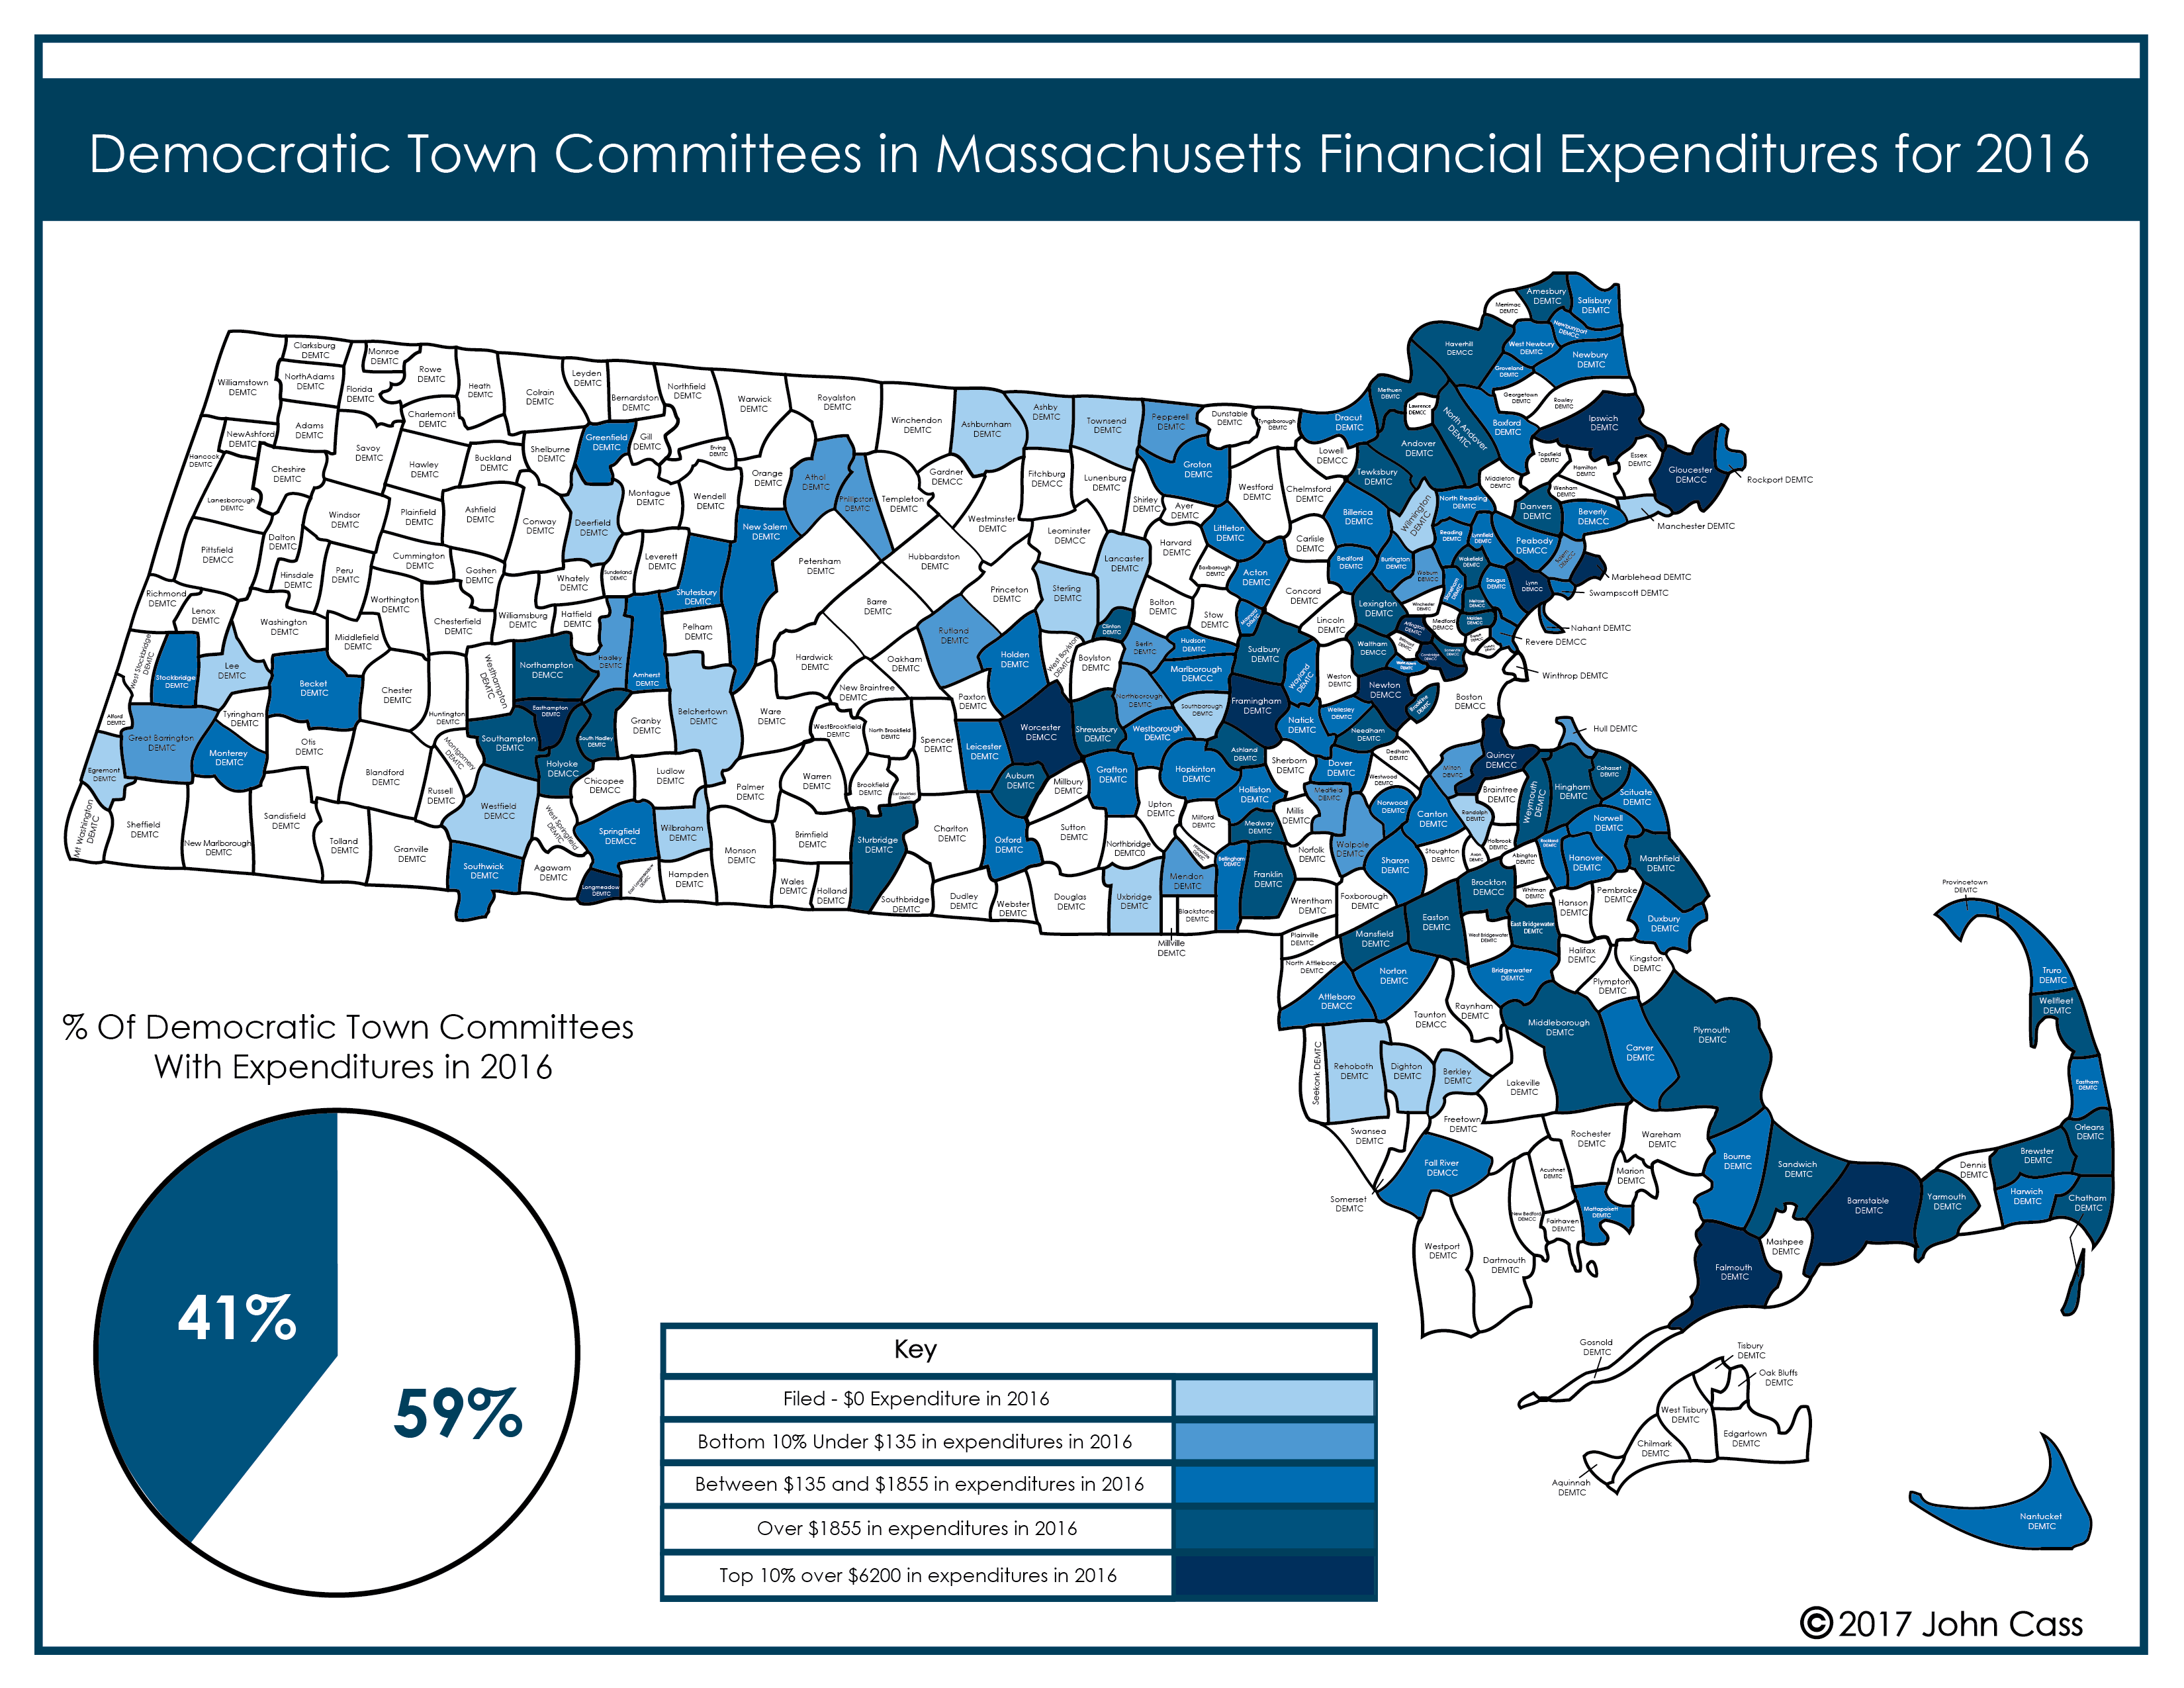
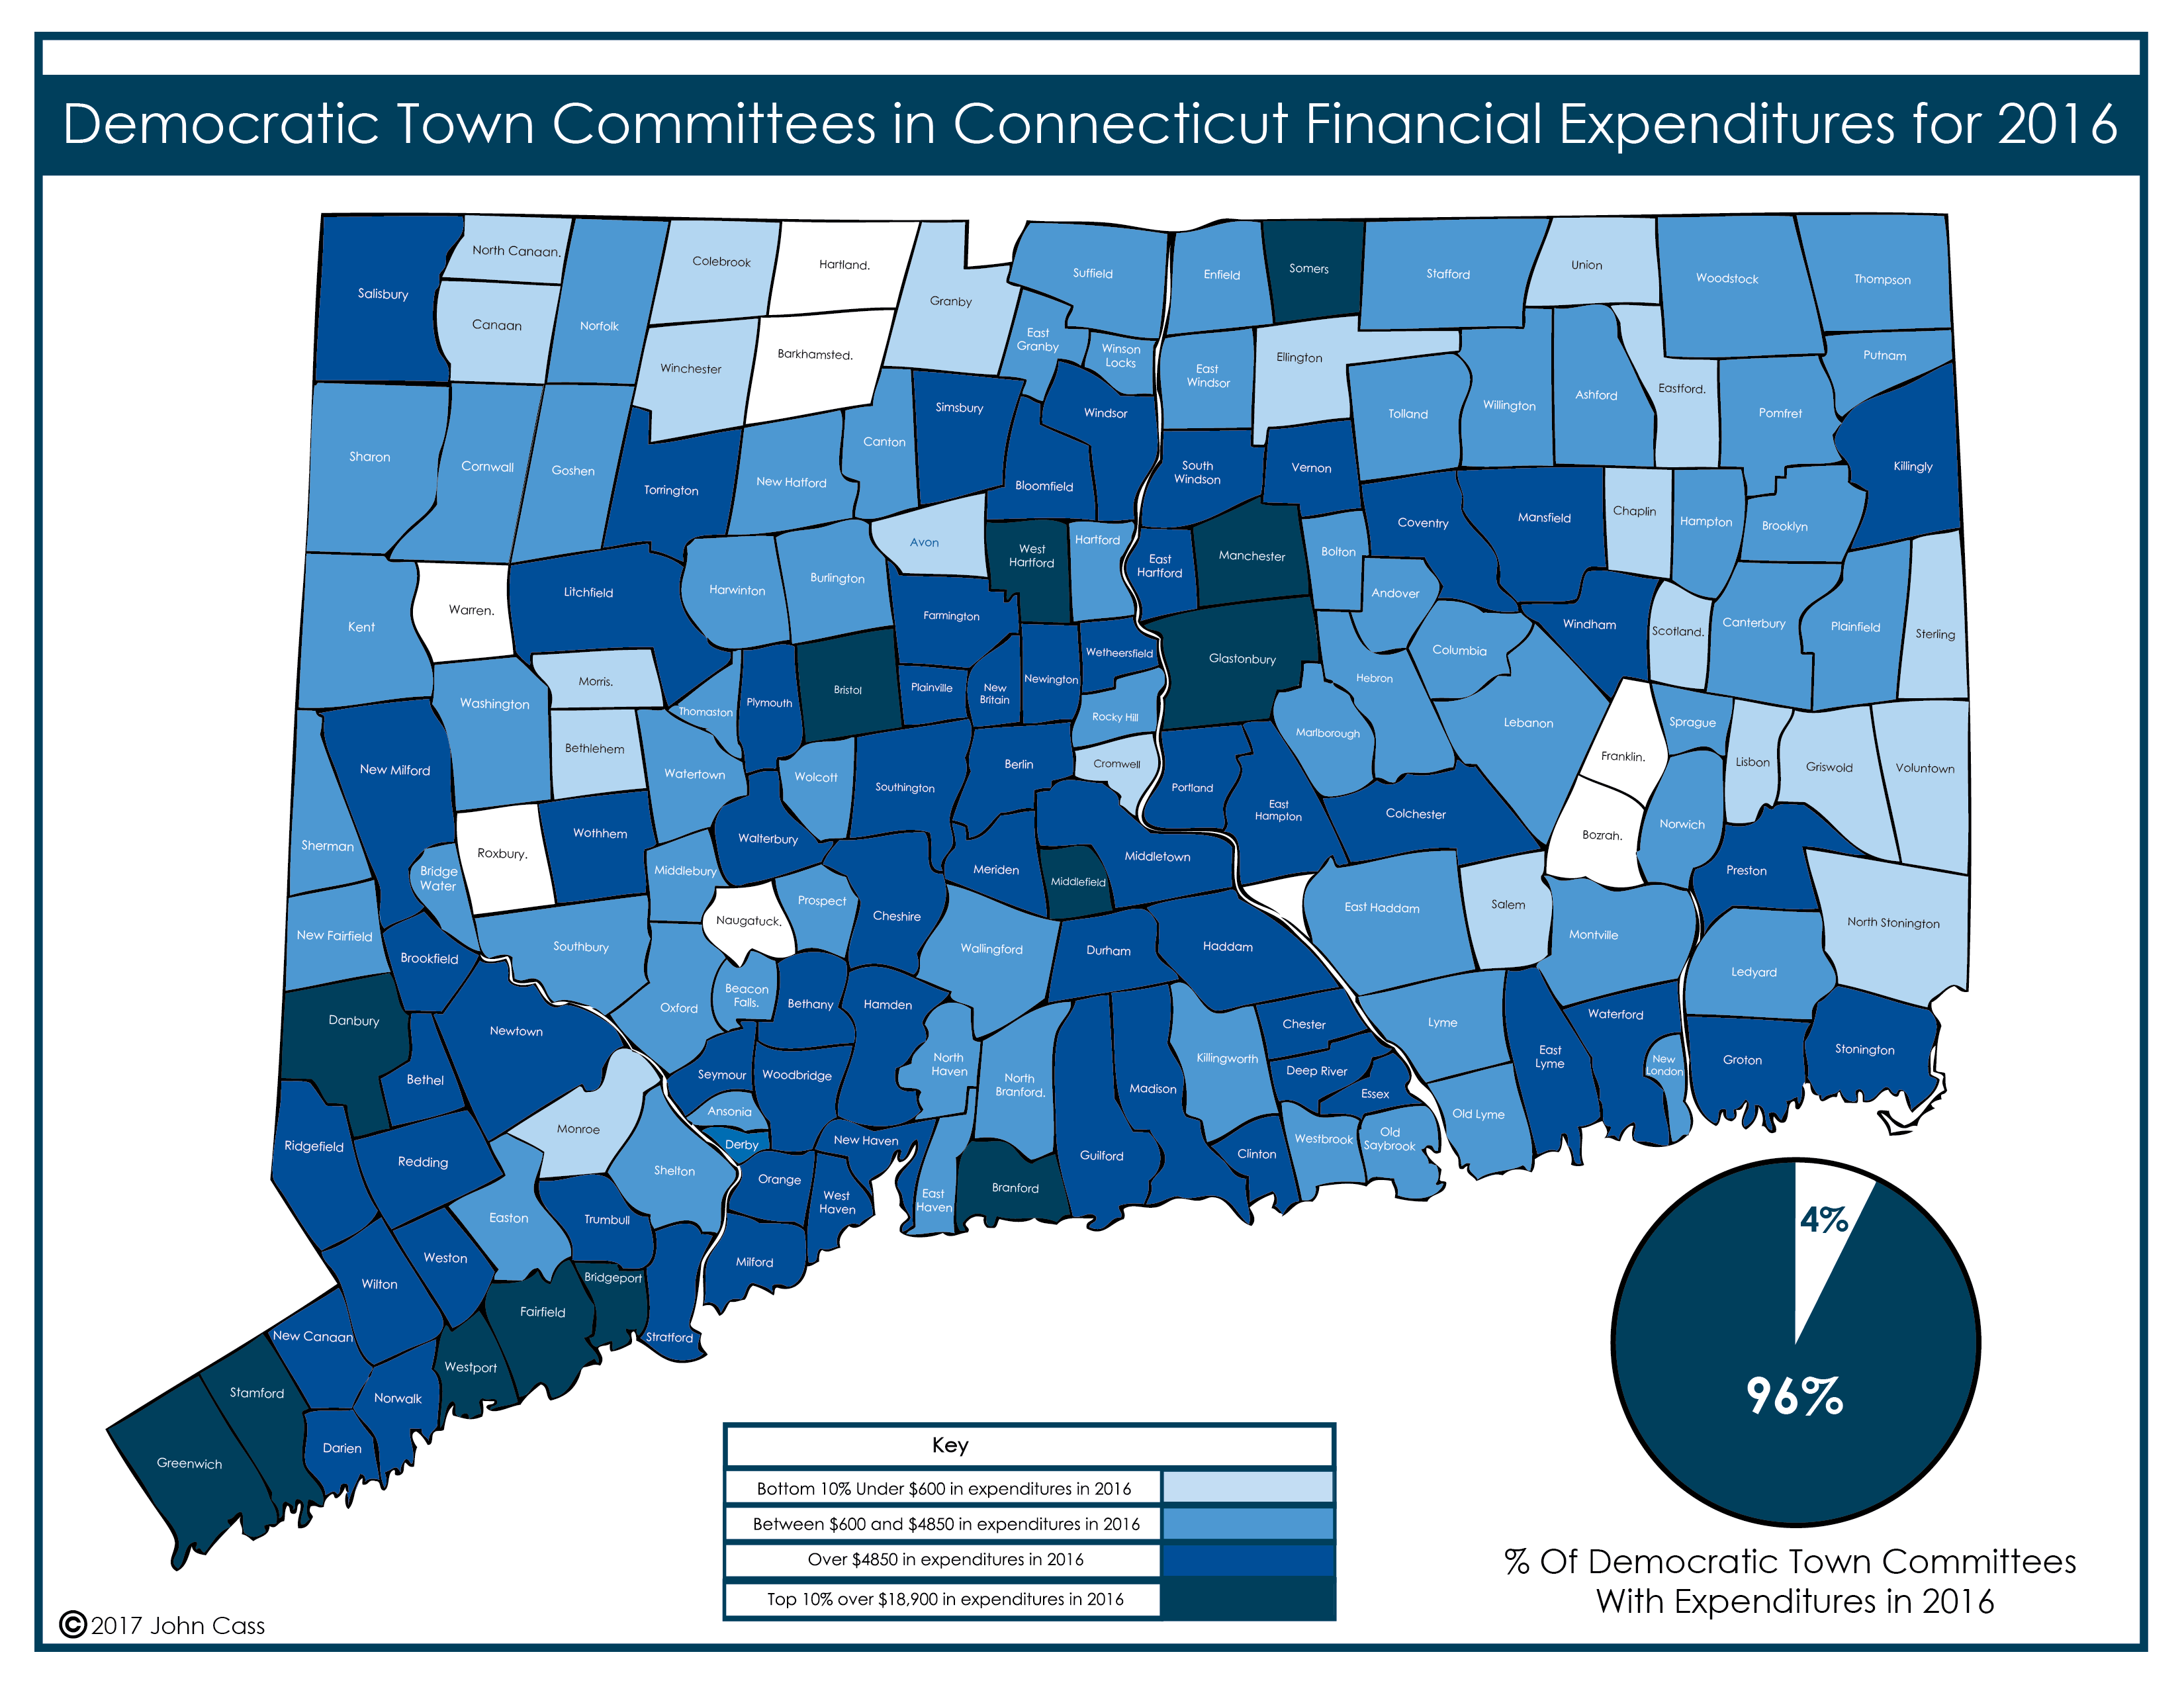
Reviewing the level of financial activity of Democratic Town Committees (DTCs) in Massachusetts compared to DTCs in Connecticut, 41% of Massachusetts DTCs spent money in 2016, compared to 96% in Connecticut.
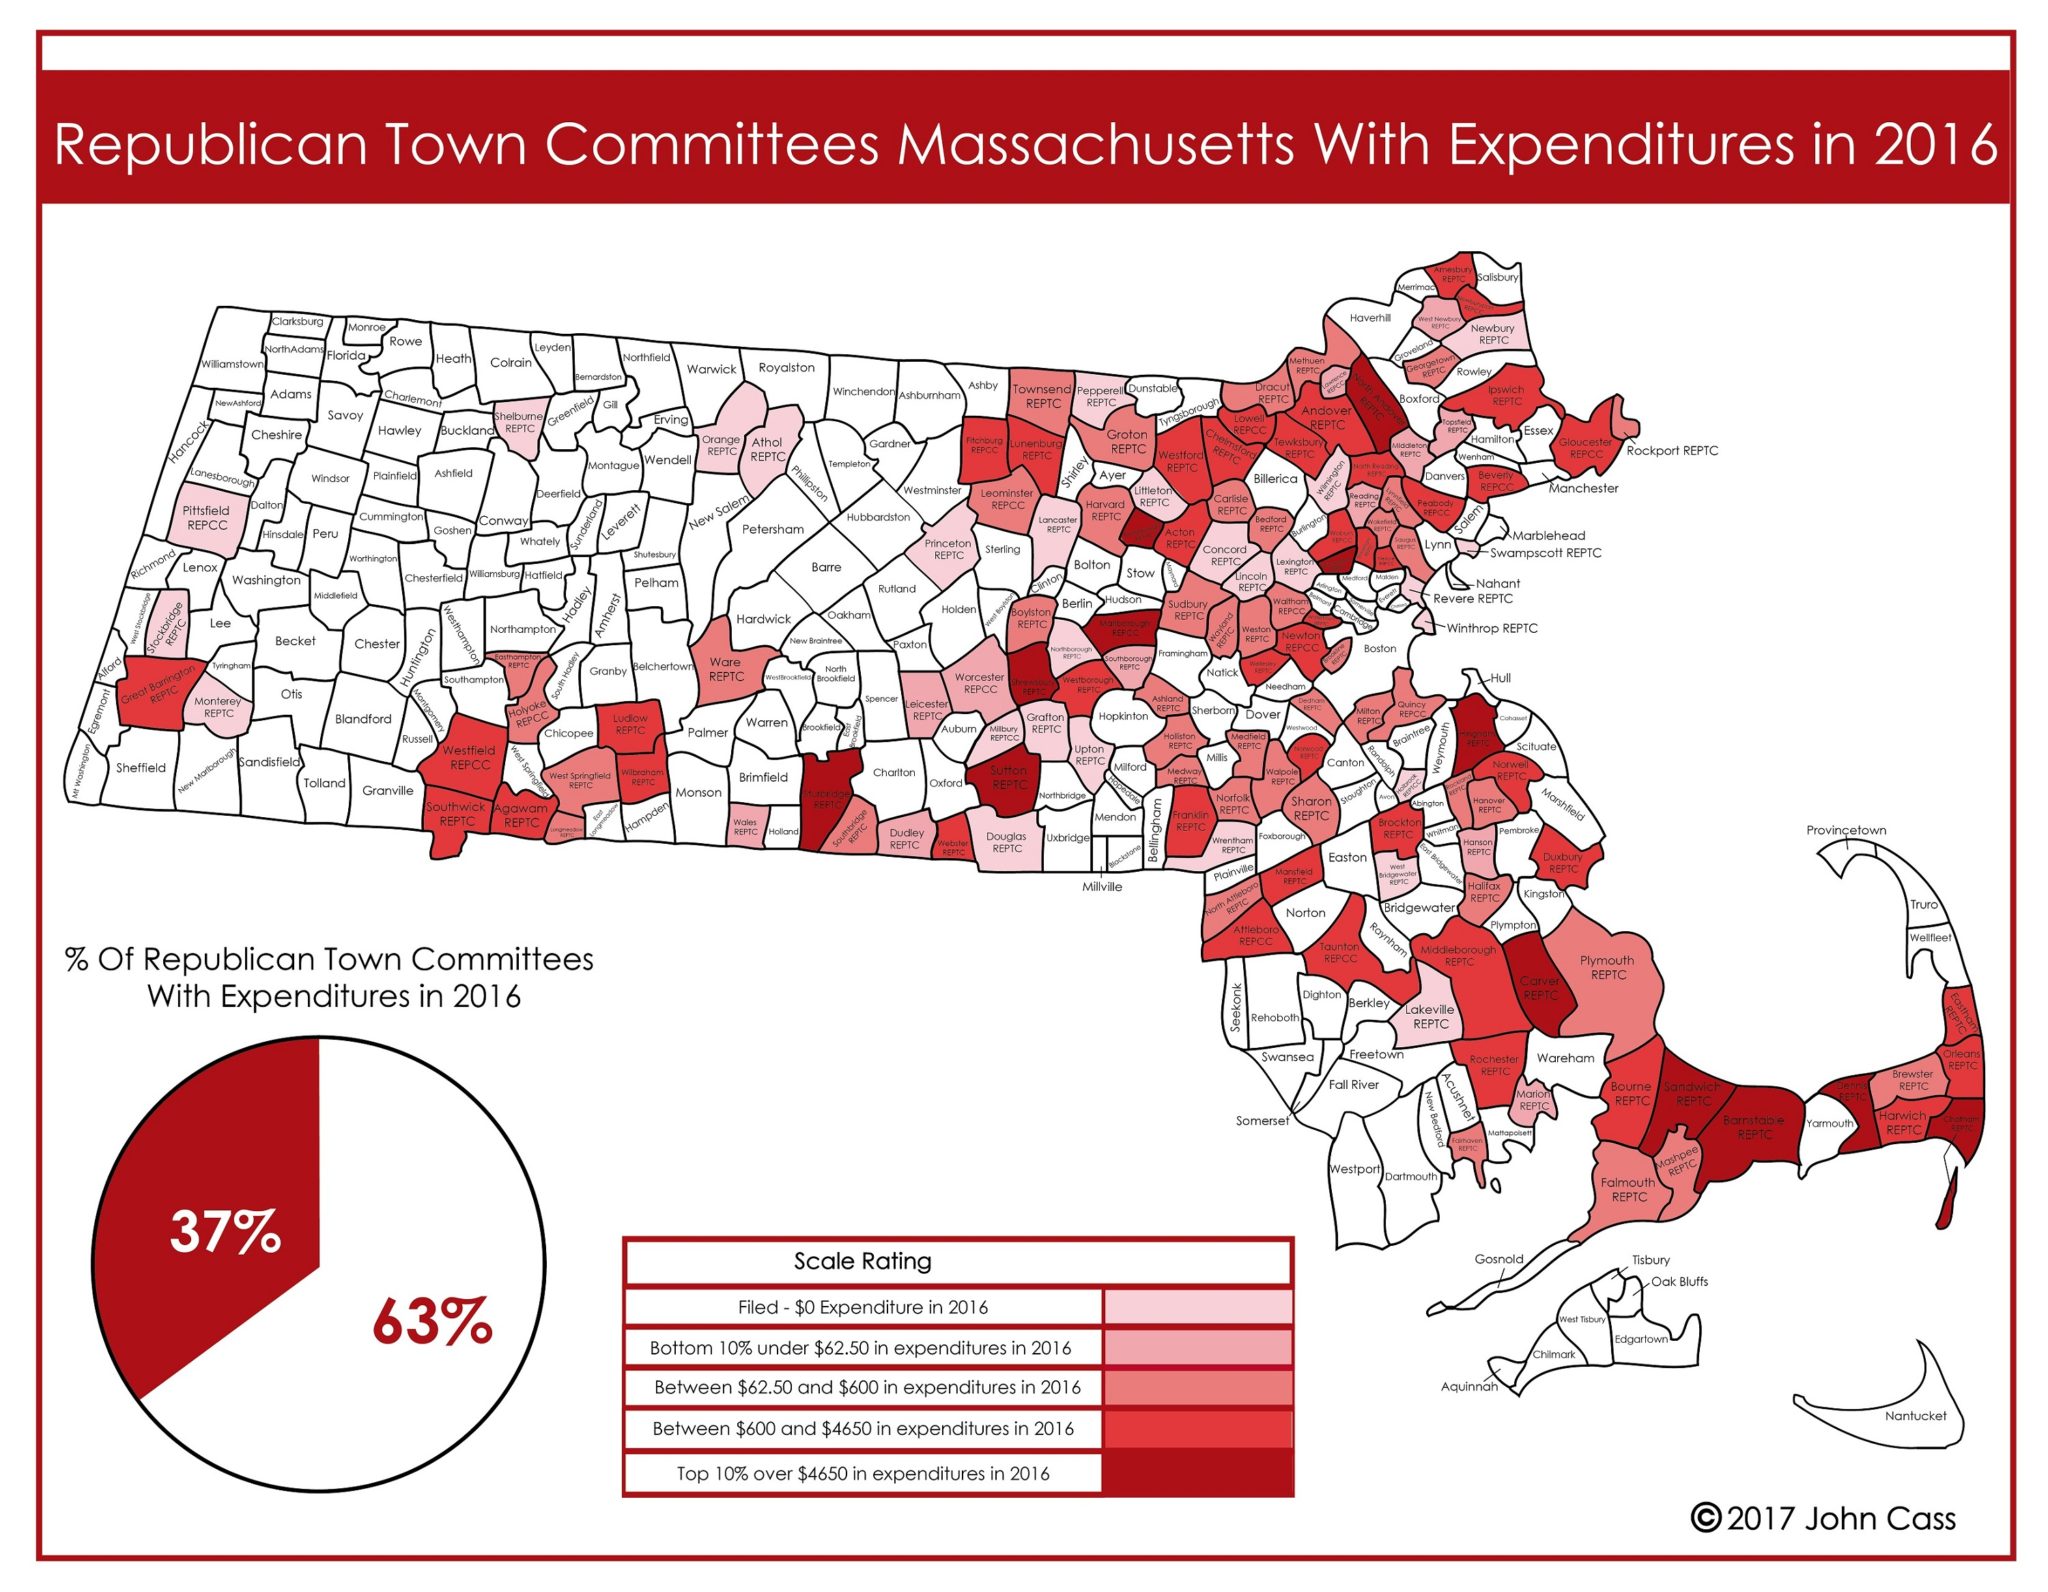
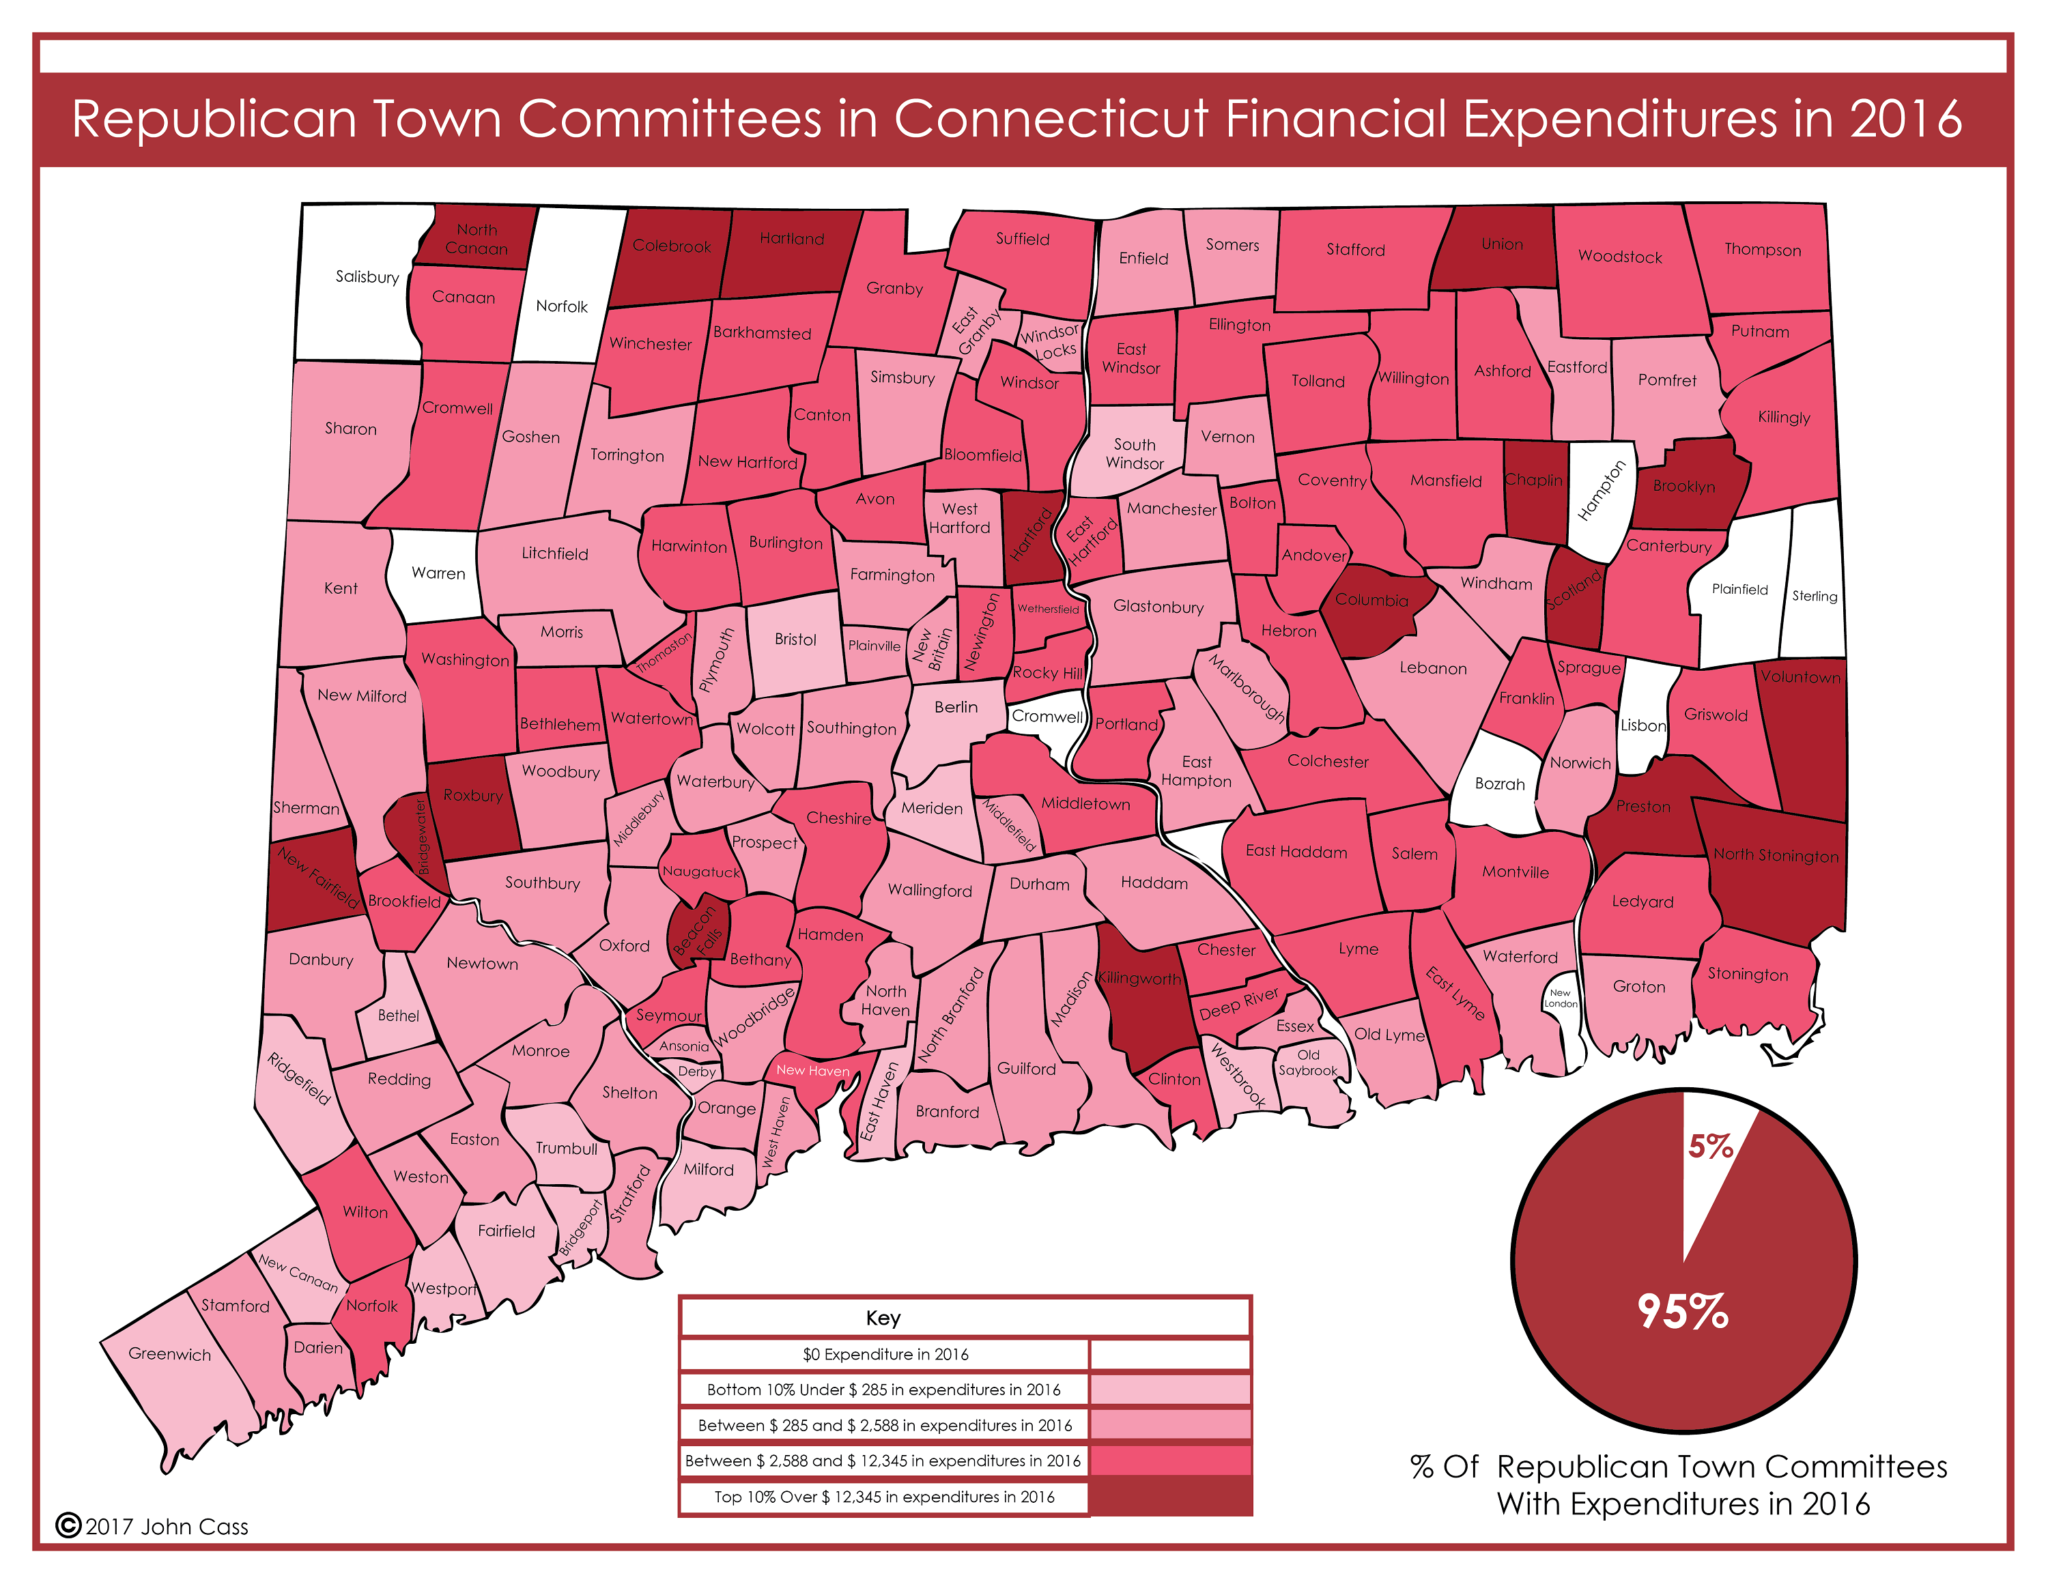
If we compare the Democratic town committees to Republican town committees (RTCs) we see 37% of RTCs in 2016 in Massachusetts were financially active compared to 95% of RTCs in Connecticut
If local political Town Committees are the starting point for political parties in the State of Massachusetts, it indicates some serious issues with how our democracy is working at the local level. And with the comparison of Democratic and Republican town committees and their close approximation across the two political parties in the two States of Massachusetts and Connecticut, there seems to be some structural issues happening with both States.
The 1938 Massachusetts Charter Change
In 1938 the Massachusetts Charter was changed so that local town and city political committees were set at a maximum of 35 members.
Before that time Massachusetts local political committees could have the number of members set by the political committee. In Connecticut, town committees still set the number of members.
In Connecticut, city and town wide elections for local political parties are run every two years, not every four years as they are run in Massachusetts. It used to be that in Massachusetts the town wide elections were every two years, but that was changed in the early part of the 20th Century.
All of this local town committee data can be found on the Massachusetts Office of Campaign and Political Finance and Connecticut State Elections Enforcement Division.
Comparing The Maps
If we look at the financial activity of both Democratic an Republican town and city committees in 2016 we see that Democratic town committees were 41% active and Republican 37% active.
And the data comparison for Connecticut is that Democratic Town Committees were 96% active in 2016, and Republican Town Committees were 95% active.
Why The Differences?
What are causing these differences between the two states and Political parties? Both states are New England States with many similarities in terms of town Government, both States don’t have County Government except in the case of one County on Cape Cod for Massachusetts.
I’d suggest the reason for the lack of political activity at the local level in Massachusetts is because of institutional advantages of existing members in local DTCs and RTCs. There’s a lack of change in both political parties, and as such the existing establishment doesn’t get refreshed in terms of members as often as its possible in Connecticut. One because Connecticut allows more members to join, and two because their elections are held every two years, not every four years as they are in Massachusetts. If we’d like to see stronger political parties across the Commonwealth in both parties, we’ll need to remove the 35 rule, and run elections every two years, and not every four years.